
Last updated on 23rd November 2023
Most people appreciate that links are perhaps the most important factor in getting a page to rank on Google. But not all links are created equal!
Links from very high-quality, trusted websites carry much more weight. And – not surprisingly – they’re the most difficult to secure.
So what if I told you that a small creative agency from the UK has received 20 backlinks from Forbes, 19 from Entrepreneur, 4 from the BBC, 23 from Hubspot, 4 from AdWeek, 11 from the NextWeb – and thousands more high profile businesses (including lots of our actual competitors?)
What if I went further and told you the budget for this was basically zero?
And what if I told you that this is based on a strategy that YOU could replicate, not just once, but time and time again, with similar results?
In this article, I’ll explain this model in detail, run you through a step-by-step guide on how you can do it and show you how we’ve just implemented this strategy for Project.co as well!
Background
As I’ve written before, Project.co was created to address a very particular need: to manage projects for our original brand, Wyzowl, the animation studio I set up back in 2011 and still run today! See our showreel below 😉
As we looked to grow the Wyzowl brand in the early part of the decade, I wanted us to be seen as experts – as an authority in our industry.
A large part of that was achieved by creating content for our audience: stuff that answered questions, gave advice, shared our expertise.
Of course, you can’t write credible, high-quality content without backing up opinions with solid facts. We used dozens of data points and statistics in every article we wrote, linking back each and every time to the original sources, which were often already years old.
And that’s where the idea came from: why not generate our own data? We could deepen our understanding of the industry, be seen as industry leaders rather than followers, and, instead of linking to other people’s research – they could link to ours.
So, in 2014, we set up a survey through SurveyMonkey, promoted it through our email lists and social channels, and managed to gather 251 responses. We were pretty happy with the results, and – 12 months on – we repeated the exercise. This time we asked more questions and got more people to respond.
The success has snowballed from there. Since 2014, we’ve conducted 6 highly successful annual surveys in a row for Wyzowl. It’s helped us build deeply insightful year-over-year trend data set that’s incredibly valuable to us and unrivalled in our industry.
Why does this approach work?
Quite simply, it works because the data generated is new and unique. It can’t be found anywhere else. It’s also topical and actively being sought out by other people. This combination means we are providing the market with fresh, up to date data on a niche topic that’s relevant to our industry. We’re providing bloggers with the fuel they need to make their articles more credible! And in return, all we ask for if people use this data in their own articles is a link back to our site.
Original data has helped us secure literally thousands of backlinks for Wyzowl including some of the high-profile ones I mentioned earlier. We’ve amassed over 7,500 backlinks to our survey pages (over a third of our site’s total backlinks…)
And, since we’ve already established that quality is even more important than quantity, I should make it clear again that these links routinely come from high-authority websites.
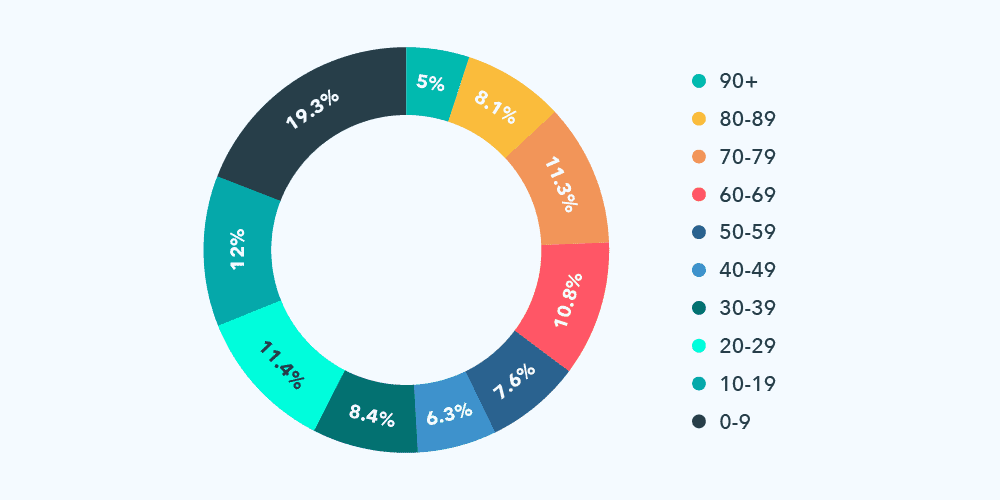
Looking at the links we secured to our 2019 data, for example, you can see on the chart below that it’s remarkably evenly distributed. (Domain Rating is an authority score given by SEO tool Ahrefs, with 0 being the lowest and 100 being the highest.)
We share our findings on a dedicated statistics page – for free – and simply ask that people link to the data in exchange for using it. This page is optimised, as much as possible, for search engines, with keyword research informing our header tags, title tags and much of the body copy to optimise discoverability.
Links are generally seen by Google as ‘votes’ for a particular page, and – as the links come rolling in – we generally see the page start to rank well for those high volume keywords we’ve identified, like ‘video marketing statistics,’ generating further visibility and helping people discover the stats for themselves. (Which fuels more links!)
On the dedicated statistics page, we also offer a downloadable version of the full report.
So, as well as many thousands of backlinks and referring domains, we’ve also had 10,000+ downloads of the survey reports. (Depending on your goals, you might choose to gate this report – we personally don’t, although we have done in the past, because our objective is more about getting our data out to as many people as possible, rather than imposing barriers.)
The value of a link goes far beyond the individual pages, too. Our overall domain authority has soared thanks to such a high volume of quality links to our site.
This helps boost all the other content on our site, too, increasing organic traffic across the board. In fact our organic traffic has grown by over 1,000% since 2015. Trust me – this would have been literally impossible without our surveys and reports.
How we plan to use this strategy for Project.co (Step-by-Step)
So, with all of that said – having stumbled upon such a proven ‘win’, I’d have to be certifiably insane not to use it for Project.co too, right?!
As you might expect, it was one of the first things we decided to do after launching the product around September last year.
We’re still in the midst of promoting and launching this data, but for now, I wanted to walk you step-by-step through what we did, how we did it…and how you can do it too!
STEP ONE: Conduct a survey
First things first, you need to decide what sort of survey you want to run: what data do you think would make an impact in your industry? What assumptions would you like to prove or disprove? Is there any out-of-date data you see referenced commonly in your industry that you could refresh?
You want to satisfy 2 criteria with your topic:
- Your topic needs to be something that people regularly write about.
- There needs to be a space for your data. Is the existing data that gets referenced old and out of date? Or are there things that you or other people write about that nobody has data on currently?
If you can satisfy this criteria, then there’s probably a good chance that people would reference your new data if they knew about it.
After doing lots of research, we decided to run a survey around communication for Project.co – a central issue that’s relevant to our product offering, and something that a lot of people are clearly interested in writing about.
We created the survey using SurveyMonkey, which is an incredibly easy tool to use. One top tip we’d offer here is to keep in mind the data, even when designing the questions. Offer fewer options where possible, to avoid diluting your end statistics.
Once set up, we promoted the survey via our own databases and social channels. If you don’t have a big audience or can’t get enough respondents (I’d suggest 200 respondents minimum to give a reasonable sample size) then you could also use the SurveyMonkey audience panel. This is a good solution to consider if you’re struggling to generate a big enough sample through your own channels, although be aware that the more targeted your audience sample, the pricier it’ll be to buy responses. It works better if you’re looking to gauge opinions among ‘Joe Public.’
We left the survey to run for around a week, then closed it and examined the data.
End result: After doing this, you’ll have generated fresh and unique data – around an interesting, relevant subject.
STEP TWO: Create a results page
Once the data is generated, it’s time to create a web page to show off the results. You can see the page we created for the Project.co Communication Statistics here.
This is extremely important to the overall strategy, because the page is the resource that people will link to. You want to make sure the page is nicely designed, easy to navigate – and ultimately, quick and simple for people to use and share the data.
On our page, for example, we used ‘copy’ and ‘tweet’ buttons to help people capture and use the data within seconds.
End result: You have a page that people can link to in exchange for using the data in their own articles and content.
STEP THREE: Create a downloadable report
For reasons already discussed, it’s often a good idea to create a downloadable report that includes extra data and analysis. You should ask people to fill out a form to download it, as this creates a starting point for a further conversation which could ultimately lead to a sale.
How this looks and feels is up to you. For us, we create a PDF report – which gives us lots of freedom to create a nicely designed document – and then send a link to the document by email once someone completes the short lead capture form.
End result: When people find the statistics, a percentage of them will also download the report. This acts as a touchpoint with a new potential customer. Growing your list in this way can also help you collect more responses for future surveys!
STEP FOUR: Guest posts
As we’ll go on to cover in more detail, statistics don’t often require ongoing promotion – but they certainly do need a jump start.
We find a great way to give new data an initial push is to write guest posts on high-authority websites. (You can find sites that accept guest posts by searching for “<your industry> “write for us” or “<your industry> “guest posts”.)
It’s often easier to secure guest post placements on high-profile websites when you have unique data. Data-based posts that share highly relevant, interesting and timely information are enduringly popular – so it’s a bit of a no brainer for blog editors.
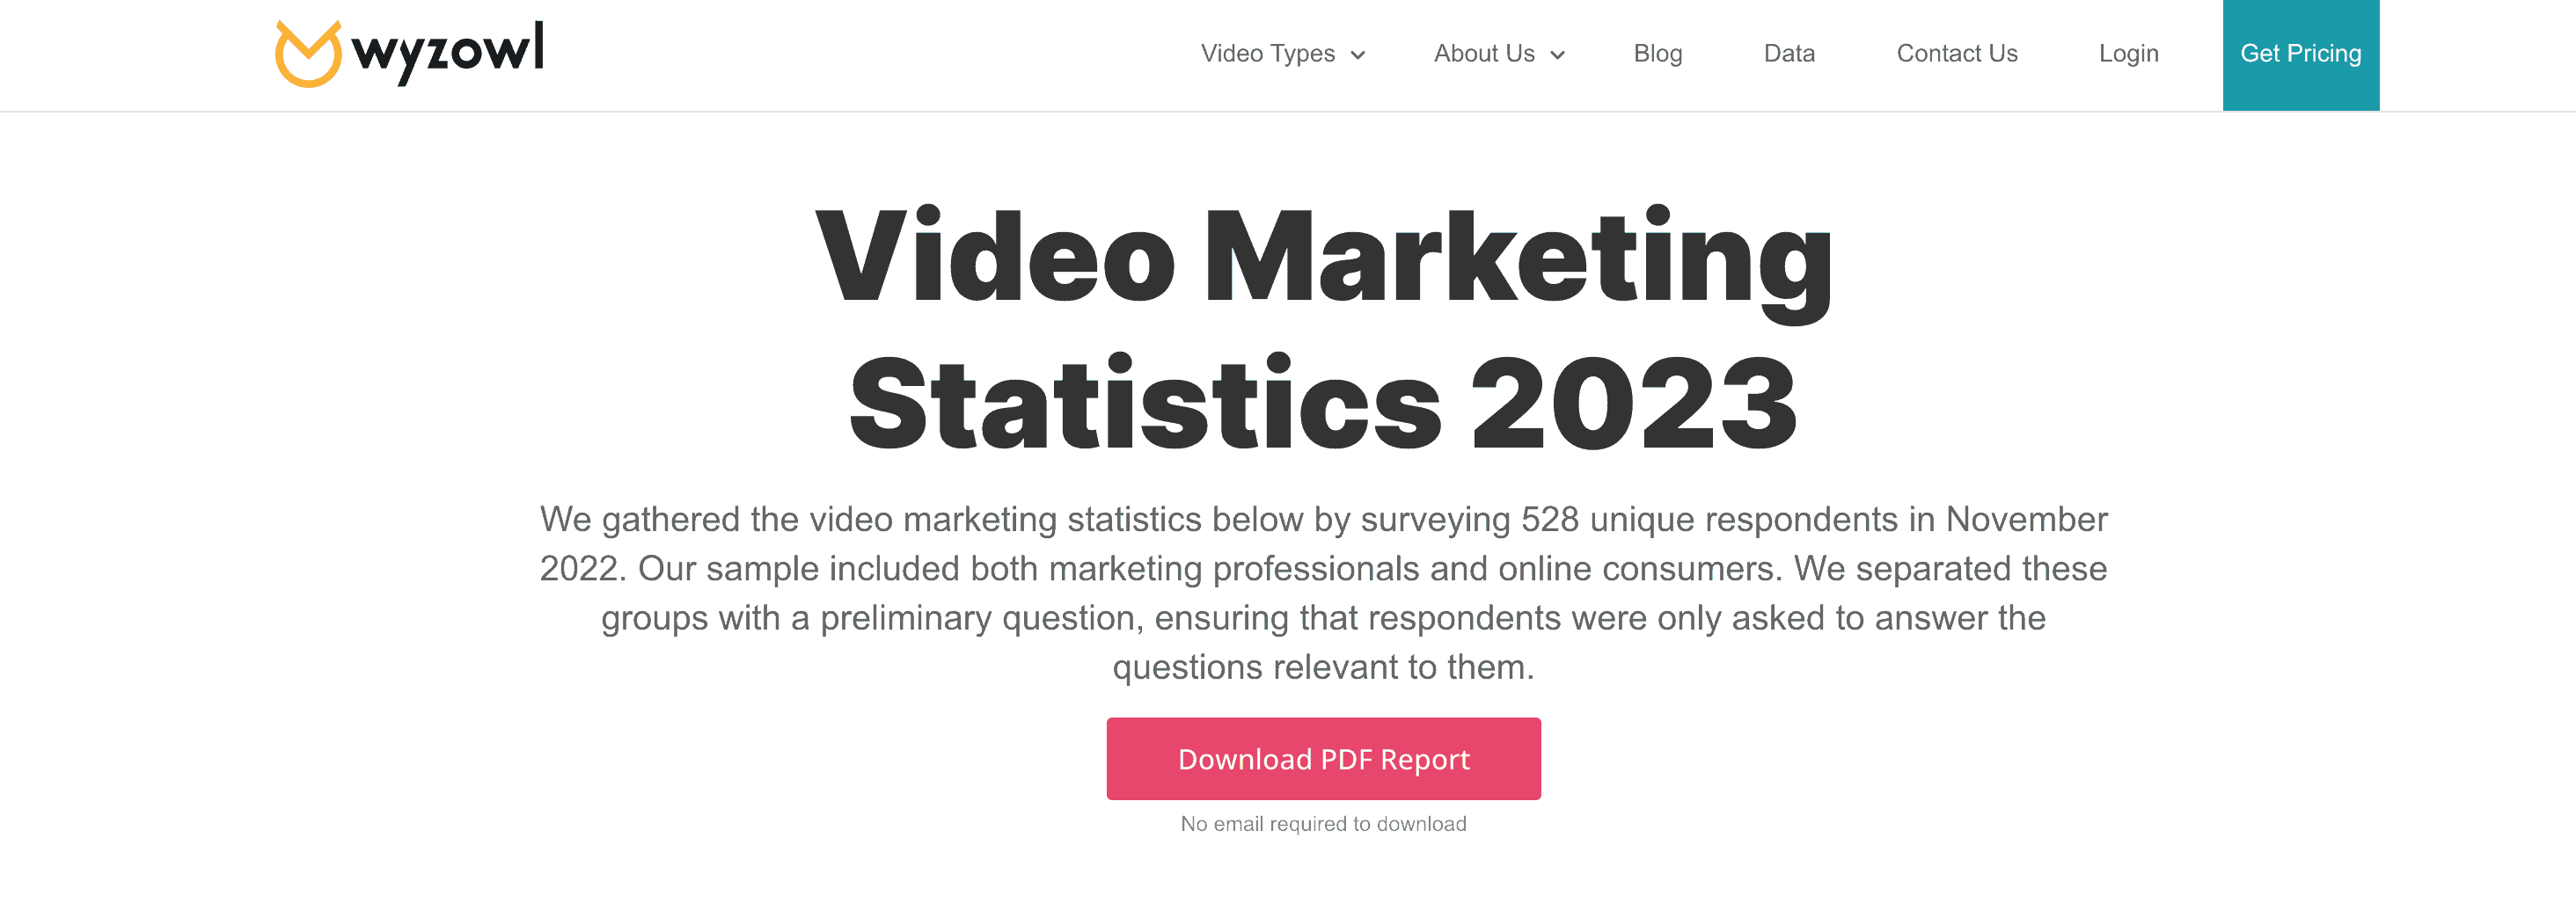
For example, many years ago we managed to secure a guest post on Hubspot for the Wyzowl Video Marketing Statistics, see below:
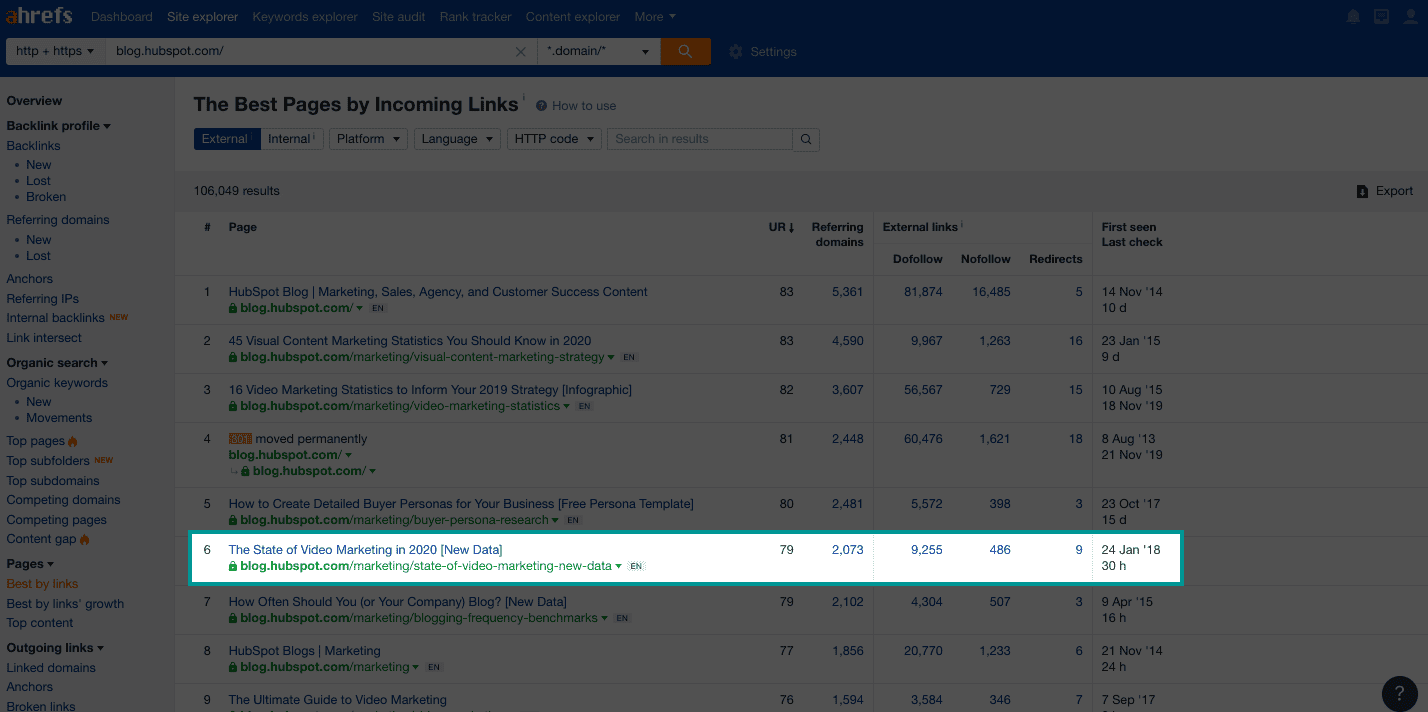
Over the years, we’ve worked with Hubspot to update this page with each new set of results we generate and at the time of writing this post it has just under 10,000 backlinks from 2,073 referring domains. Interestingly this post has become the 6th most linked to page on the Hubspot marketing blog which consists of over 12,000 articles. We’re quite proud of this incredible feat! If this doesn’t show the power of original data in a popular niche I don’t know what else does. See below:
Publishing your hard-earned data on someone else’s website is obviously an approach that has pros and cons. The benefits are that you generate initial traction, visibility and get your data in front of a big audience, so they can start engaging and (hopefully) sharing it themselves.
The drawback is that there’s always a chance people will discover and link to that page instead of your own. However, the ethical way of sourcing statistics is to quote the original source – so you have to hope that people will click the link in your guest post and link to your original page.
In any case, we always find the benefits outweigh the drawbacks, since the initial exposure (and high-quality links) offered by a guest post are a key part of generating the initial traction to begin with.
So we’ve also replicated this with Project.co on Hubspot. We recently secured a guest post summarising a few of the key communication statistics we’ve gathered. See the post here:
End result: People start finding the statistics and linking back to us.
STEP FIVE: Use the data in our own work
The data generated through surveys like this is a goldmine to be used in your own articles and content. It can add real depth and insight to your writing – corroborating your own opinions with quantifiable facts.
It can also dictate your editorial output and content calendar. You can actually start to unpack the data you’ve uncovered and write whole articles around your findings – empowering you to lead the conversation in your industry.
Every article, potentially, is another vehicle to help people discover your data and use it in their own writing.
End result: More people find the stats, and link back to the page. Sense of thought leadership bleeds into everything you promote – great for your brand!
STEP SIX: Promote, promote, promote…and then relax!
Imagine you’ve got a massive boulder, sitting at the top of the biggest hill in town.
If you don’t give it an initial push – it’ll just sit there forever.
But once you have given it the first push, it starts to pick up its own momentum and build speed without you taking any further action.
That’s a really good metaphor for promoting original data.
If you don’t do any initial promotion – through guest posts and optimisation – you can’t realistically expect to get any results at all.
But once you’ve given it that kick start, you’ll start to find that the network effects become much greater than any promotional work you could do. For example, each of our Wyzowl survey pages grows in the number of referring domains linking to it by around 80 per month, per page!! This is far more links than we could generate manually.
End result: Network effects take over and we generate substantially more backlinks than we could generate ourselves manually.
Conclusion
Original research is a straightforward SEO tactic that should be used at the start of your SEO strategy. It will help you build backlinks, traffic and authority.
You’ll find it’ll also help you rank all your other content more successfully – and position you as an authority in your market.
My advice – get started today! You won’t regret it 🙂
